Reporting on Surveys
Survey results can either be viewed within Upshot or downloaded for further analysis.
- Viewing individual survey responses
- Viewing all survey responses
- Viewing comparison results
- Downloading survey responses
- Downloading survey responses (including personal details)
- Additional tools
- Standardised Questions
- Key Terms
Viewing individual survey responses
An individual attendee's survey results can be viewed either directly on their attendee profile or from within the surveys themselves.
Attendee profile
When viewing the Personal details section of an attendee profile the right hand-side will contain a Summary of everything they have attended.
Following this down users will also see any media associated with the attendee, as well as any Outstanding and Completed surveys.
Clicking on any of the Completed survey results will bring up this attendee's survey response.
Note: Results will only be shown on an attendee profile for Standard surveys, that are directly attached and associated with attendee profiles. Anonymous surveys although sent/completed by individual profiles have results that are not associated with individual attendees to protect their anonymity.
Within the Survey function
Within any survey there will be deployments (folders) containing completed survey responses.
Individual responses can be seen by clicking within these deployments and view under the attendee name/response number.


Note: There will not be the 'view' button shown for individual responses for anonymous surveys to protect the anonymity of these responses.
Viewing all survey responses
Results for a specific survey deployment (folder) can be viewed on-screen.
Upshot will display the performance of questions where percentages can be derived under a heading called Responses.
This will be shown for any questions in your survey that have pre-defined options in their responses and the results will be shown here. This applies to the following question types - i.e. Whole number, Scale, Yes/No, Single choice, Multiple choice and Count).

These results will be shown for a particular deployment (folder) of survey responses.
To access these for your organisation's survey please follow the steps below:
- Go to Evidence > Show Surveys
- Find the correct survey and click view
- Within the survey find the correct deployment (folder) of responses you would like to see the results for and click view

Underneath the individual responses, you will see the header Quantitative responses.
Here will be any bar charts displayed in relation to your survey responses.
These graphs can either be printed/screenshot from the system for users' reports.
Viewing Comparison Results
If the survey is set up correctly, users will have the option to compare specific deployments (folders) of survey responses.
This can be especially powerful in seeing the change in responses to the same questions for individual attendees or groups of attendees over time.
To find out more please refer to the Comparing Surveys guide.
Comparing Deployments
When comparing two deployments, only responses from participants who have responded to both instances of the survey will be included in the comparison.
From the viewing page (once results have been submitted in both deployments) you will have the option to compare survey results.

Summary of Comparison Results
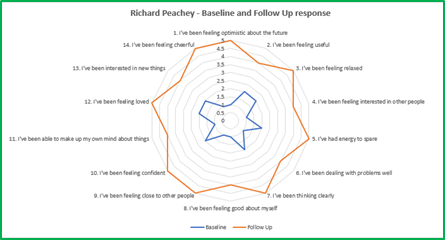
Depending on the type of question asked you will get a comparison question by question. The example below is a comparison of a scale question.

Not only will the system give you a comparison of the overall results, but it will also allow you to quickly look at individual’s results across the two deployments:

Downloading Survey Responses
Users can also download all survey responses for further analysis.
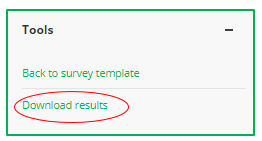
The option to download will be presented under the Tools option on the right-hand side.
Users can either:
- Download all survey responses

- Download specific survey deployment responses

These two downloads will look like the below, with a

- Download a comparison of survey responses

The download of the comparison results specifically, will be presented exactly in the order seen on screen, with the question by question breakdown, followed by the individuals responses side by side.
These three options will give users access to all the raw survey results which can be analysed further if required.
Downloading Survey Responses (including personal details)
For Standard surveys, users have the option to include attendees' personal details in their downloaded results. This effectively combines the Survey Export, with an organisation's People Report.
This can be particularly powerful for further analysis, enabling organisations to find out how people of a specific 'Gender', or from a specific 'Town', responded to particular questions.
The option to Download results (including personal details) will be available when either downloading all results or downloading the results for a specific deployment.

In the downloaded results, these attendee details will appear to the right-hand side of an attendee's survey responses.

By applying a Filter or using PivotTables the downloaded results can be further analysed.
Additional Tools
Users may also find the following guide helpful - using Upshot data to create Graphs and Charts in Excel - this guide has a specific section around downloaded Survey results and using excel to visualise these responses.
The guide around PivotTables can also give users some other ideas on how to analyse their downloaded survey results.
Note, it is not possible to use the People Report to report on those that have completed a survey.
Standardised Questions
Standardised Questions used in organisations' surveys can also be reported on in all the same ways as listed above but there also some additional reporting tools for Standardised Questions.
Reporting on Standardised Questions
System Admins can report on Standardised Questions by going to Report > Standardised Questions.
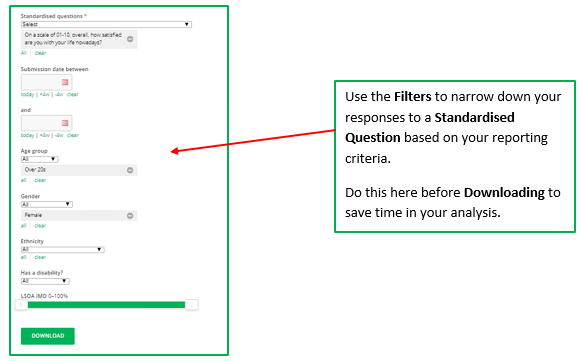
This can then be analysed to find patterns in question responses based on participants' details. To aid users analysis it might be helpful to use filters on Excel or PivotTables.
To find out more about Standardised Questions and to understand the benefits setting these up and using these in your organisation's survey can bring, please refer to the Standardised Questions guide.
Key Terms
Deployment (Folder of survey responses):
This is a folder of attendees’ survey responses. This is where you can group together certain responses to the same survey, for example for an Evaluation survey those responses related to a specific group or activity.
Also, the system can run a comparison of different deployments of the same survey. For instance, in surveys to do with Mental Health and Wellbeing it is often important to see individual responses change over time. Different deployments would allow you to measure and then compare this. I.e. Baseline results compared to Follow Up.
Standardised Questions:
Standardised Questions are survey questions that can be used to enhance the reporting available to organisations when used. Standardised questions include Upshot Global Questions, a mix of accredited survey questions and ones from large funders in the sector. Organisations can also create their own Standardised Questions.
Survey Types:
The choice of survey type (Standard, Anonymous or Public) will affect how your survey can be completed, whether it’s attached to Upshot participant profiles and whether those participants can be identified via the results.